Looking for companies with minority ownership? Data Axle, a detailed company directory, allows you do an advanced search by executive ethnicity. You can combine this with industry, location and other variables. Click on Chart or download results. The image below shows the number of businesses by sic code. You can sort by NAICS code, city, zip code, sales and employee size.
Crunchbase (available at Lippincott Library) allows you to search for companies by Diversity Spotlight. I searched for Black/African American led.
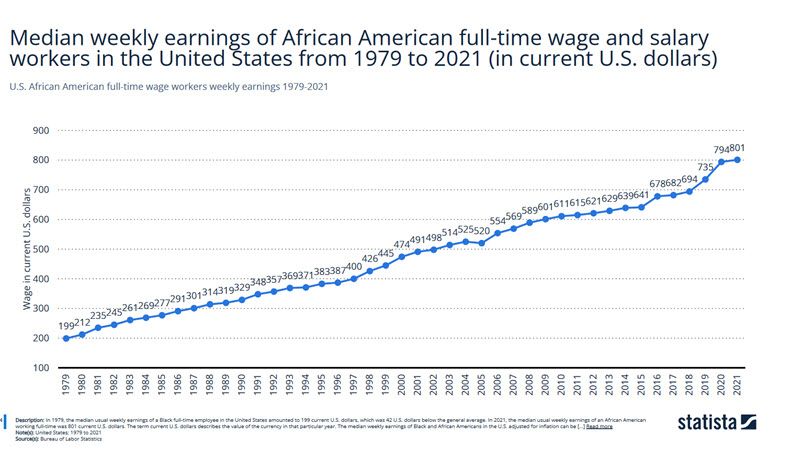
Statista is an aggregator of statistics from a variety of different sources. It is international in scope. A simple search for diversity pulls up over 216 reports from many different countries. One report, Wages and salaries in the U.S. includes a section on diversity, including the table below.
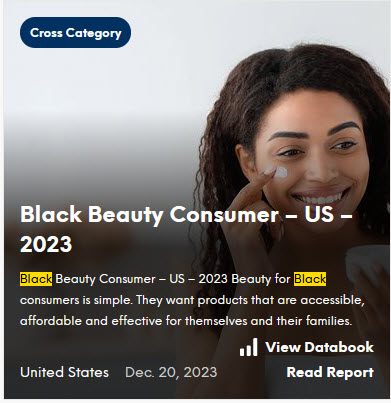
For consumer information turn to Mintel, a database of consumer surveys and new products on the market. It covers the U.S. and the U.K. I searched “black consumer.
For more information, Pew Research Center recently published a report on Black-owned businesses in the U.S.
This is just a sampling of library resources. Come to Lippincott and ask librarians to show you more resources.
Research Spotlight’s eighth installment features a paper authored by Wharton sophomore Didrik Wiig-Andersen, a winner of one of Wharton’s 2023 Summer Program for Undergraduate Research (SPUR) awards. Published in ScholarlyCommons, Penn’s institutional repository, “The impact of carbon pricing policies in reducing CO2 emissions from road transportation: a meta-analysis of empirical studies,” conducts an exhaustive literature review to identify eighteen papers that are used to analyze a variety of pricing policies in a wide range of geographies and help draw conclusions about the combined effect of their implementation in reducing CO2 emissions in road transportation.
Wiig-Andersen used a combination of subject-specific literature databases available through the library in the process of gathering relevant papers, including ABI/Inform, EconLit, PAIS Index, and more. These resources provide access to scholarly works in the disciplines of business, economics, and social policy, connecting researchers with materials from a wealth of reputable sources.
Lots of retailers want to know the answer to this question. Holiday shopping comprises a huge percentage of annual sales for retailers. Getting the correct strategy for this seasonal event is crucial. Luckily, Lippincott Library has many resources to help with strategizing, including consumer surveys, trend reports and more. What are consumers looking to buy, where are they likely to shop and what ads will tempt them to purchase merchandise.
Mintel Reports covers consumer trends and products. Focused on the U.S. and U.K., data comes from MRI-Simmons and Kantar Profiles, among other sources. Detailed methodology is provided at the end of reports. Try a keyword search for holiday.
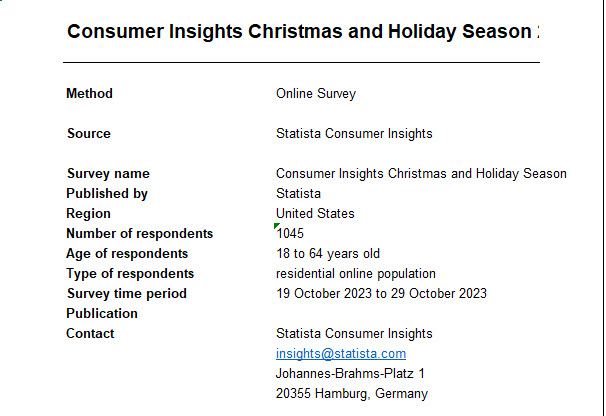
Based on consumer survey data, Statista is another good source for finding information about consumer behavior during the holiday season. It is international in scope. One recent report is Holiday Season and New Year in the US 2023, a consumer Insights data table: “Lavishly decorating their houses and gardens with light strings, real and fake Christmas trees as well as reindeer, snowmen and Santa Claus figures is only one of the many popular Christmas traditions of consumers in the United States”. Details about the methodology is clearly provided.
eMarketer focuses on ecommerce. Data comes from in-house as well as external providers. Content includes articles, audio, charts, forecasts and reports. A simple search for holiday pulls up a number of results including Holiday Shopping 2023: Brick-and-Mortar and Ecommerce will battle for Retail Channel Supremacy. Reports can be downloaded in several formats including pdf, excel and ppt.
WARC (World Advertising Research Center) includes case studies, ad spend, rankings, strategies and more on all things advertising. It is international in scope. A simple search for holiday pulled up a topic category: Seasonal and occasion marketing. Here’s an interesting article about reusing older ads. It isn’t necessary to reinvent the wheel every advertising cycle.
In Pennsylvania, almost 40% of small businesses are owned by women. This is especially remarkable, given that before 1988, women couldn’t apply for a business loan without a male relative as co-signer! Every October in the United States, we celebrate National Women’s Small Business Month by honoring entrepreneurial women past, present, and future. This year, we at Lippincott Library wanted to share ways that you might celebrate women entrepreneurs – in the month of October, and beyond.
In the first section of this post, we recommend resources created specifically for women entrepreneurs. And in the second section, we recommend ways to identify and buy from women-owned small businesses near you. In both, our recommendations aren’t meant to be exhaustive, but we hope they help you think about how you can support entrepreneurial women across the globe.
The U.S Small Business Administration offers Ascent, a “free learning platform for women entrepreneurs.” You can use Ascent to learn about strategic marketing, government contracting, growing your business, and more.
There’s also DreamBuilder, which was designed by Arizona State University to empower women entrepreneurs around the world. Through DreamBuilder, you can access free online, asynchronous entrepreneurship courses in both English and Spanish.
Additionally, the Penn Libraries provides a plethora of books, including ones that have been written by, for, and about women entrepreneurs! We’ve highlighted a few titles below, but you can find even more resources by searching the Franklin Catalog.
Locally, the Philadelphia’s Women’s Opportunities Resource Center (WORC) offers loans designed for women to start or expand their business. Loans can range from $150-$350,000, depending on need and eligibility.
PitchBook, a library database, allows you to search for companies founded by women. Use the People screener and limit by geography and industry. You can then see who provided funding to these companies and might be interested in funding your company as well.
Networking & Community
Small businesses can be lonely work! That’s why it’s important to find a community of like-minded peers who can relate to your experiences and passion.
Luckily, Penn has groups dedicated to women’s empowerment in business for both undergraduate and MBA students. For undergraduates, there’s Wharton Women, which welcomes members from all of Penn’s undergraduate schools. And for Wharton MBA students, there’s Wharton Women in Business (WWIB).
Additionally, while not dedicated to business, visit the Penn Women’s Center (PWC) to connect with more people passionate about gender equity.
Additional Resources
There are SO many other resources out there, and we can’t possibly highlight them all! But here are just a few more that we’d recommend.
So now the question is: How can I celebrate National Women’s Small Business Month if I’m NOT a woman opening or growing my small business?
Shopping at Women-Owned Small Businesses
A great way to support entrepreneurial women is to patronize their business. You can use different directories to identify women-owned small businesses by neighborhood, sector, and more.
For example, the Sustainable Business Network (SBN) of Greater Philadelphia has a directory of environmentally-focused companies that can be sorted by categories like women owned, LGBTQ owned, and whether it is a certified B corporation. You can also try Keepin’ It Small, another digital directory for Philadelphia businesses. Note that for both directories, all information is self-reported and members pay a fee to be included.
Additionally, we have resources here at the Lippincott Library to screen for small businesses owned by women. Like PitchBook, D&B Hoovers enables you to build lists of similar companies. You can use it to screen for women-owned businesses by starting a new Companies search and expanding the fields under Company Type. You can run similar searches in Data Axle, which covers the U.S. and Canada. Use the advanced search to limit by industry, gender, and job title.
Email us at lippinco@wharton.upenn.edu with any questions about using our resources to screen for women-owned small businesses.
Celebrating Entrepreneurial Women All Year Round
Even though October is ending, the great news is that all of these resources are available throughout the year. We don’t need to wait until next year to celebrate the entrepreneurial women around us, across the country, and around the world.
Struggling to develop a comprehensive set of terms for your literature search? Save time and effort with the R package litsearchr. This suite of text-mining and keyword co-occurrence network tools makes it easy and reproducible to expand your first seed articles into a more thorough search string.
In the past decade, many companies have moved toward greater disclosure of information related to Environment, Social and Governance (ESG) factors, with metrics ranging from greenhouse gas emissions to corporate board gender diversity. These disclosures are usually made through some form of annual ESG report or through several different reports covering various aspects of E, S and G. For example, Apple produces both an Environment Report, as well as an ESG Report and Index.
Leandro (Leo) Pongeluppe, Assistant Professor of Management at Wharton, was interested in analyzing how firms’ reporting on ESG factors has changed over time. To do this, he was interested in gathering both regular annual reports to shareholders (ARS) and ESG reports. The reports would be analyzed by the amount of environmental textual content and sentences with emotional content. In addition to analyzing the text, Leo was interested in analyzing these reports by looking at the color(s) they used, specifically at the pixels with green. In collaboration with a group of researchers, he had done similar analysis related to Brazilian firms but was hoping to test against a US-based sample to see whether the results were generalizable to other geographic areas. He was hoping that there would be a solution to gathering these reports that would not require searching the websites from each firm of interest.
Our research services team assisted with this project in the following ways:
Data source evaluation – ESG reporting is much more varied than standard financial reports and the subscription resources that include these reports may not do so consistently. Even if ESG disclosures are pulled together as a screening category, there is additional work necessary to identify the relevant reports when multiple files exist. We examined several resources that include these reports (Bloomberg Professional Service, Refinitiv Workspace, S&P Capital IQ and S&P Capital IQ Pro) to determine which would most reliably provide reports. We also identified potential issues related to trends in US firms’ use of the regular ARS that could impact the research. Many US firms are either not publishing separate annual reports and are instead relying on the 10-K filing as the sole annual document, or are publishing items they are calling “annual reports” that just include a brief cover sheet and then the 10-K. These reports would not have the desired color element.
Data extraction instructions – We developed a standardized method for pulling the reports. It is against the licensing terms to run a script in our subscription resources to extract reports, so we worked through the most efficient way to export them so that future Research Assistants would be easily able to extract additional reports by following the standard procedures.
We pulled a sample of more than 750 reports for a five-year period for firms that appeared in the Fortune 100 as proof of concept, making them available in shared storage folders. We also created a standard operating procedure document and a summary document indicating any gaps in coverage for each company.
The Lippincott research team can help you think through creative approaches to projects like this. Get in touch with your departmental subject specialist for assistance.
Tableau Desktop, a data visualization and exploration tool, is now available at Lippincott Library. Through this software, users can build a variety of interactive charts, graphs, maps, and dashboards. With its no-code required, drag and drop interface, it’s a great resource for beginners and seasoned data analysts alike. You can upload your own data and combine multiple data sets or use a sample set provided in the tool. Unlike Tableau Public, the desktop version allows individuals to connect more data sources, read CSV files, and save work locally. To view a real-life example of Tableau in action, visit Penn’s Diversity Dashboard linked here. To get started with Tableau Desktop, visit the Lippincott Library Information Desk.
Taking a class that requires expensive statistical software? Maybe you use R or Python and your laptop just broke. Current Wharton students (plus staff and faculty) have alternatives that won’t cost extra.
Modeling performance of firms in China? Use CSMAR (China Stock Market & Accounting Research) to gather data on China’s stock markets and listed companies.
As of July 1st, Bloomberg is available on campus, as it was prior to Covid 19. It is no longer available remotely. You can access Bloomberg at the physical terminals located in Lippincott Library or in Huntsman Hall.
For those working away from campus, there are alternative resources available remotely, such as Refinitiv Workspace and S&P Capital IQ, which may provide similar information.
Refinitiv Workspace, which covers financial market information, is a web-based application. While on the go, researchers can access the information they need, like stock and equity prices. For example, to find fixed income data, select Markets and then choose Fixed Income. You can then drill into areas like bonds, loans and credit default swaps.
S&P Capital IQ also provides financial market information. Type in a company name to get started. Use the filters on the left to find information such as balance sheet data, investments, and relationships to suppliers and customers. You can also screen for companies by using the screening tool. Refinitiv has a similar function.
For more information about any of these resources, please contact Lippincott Library for assistance.