Tis the Season to…Shop???

Lots of retailers want to know the answer to this question. Holiday shopping comprises a huge percentage of annual sales for retailers. Getting the correct strategy for this seasonal event is crucial. Luckily, Lippincott Library has many resources to help with strategizing, including consumer surveys, trend reports and more. What are consumers looking to buy, where are they likely to shop and what ads will tempt them to purchase merchandise.

Mintel Reports covers consumer trends and products. Focused on the U.S. and U.K., data comes from MRI-Simmons and Kantar Profiles, among other sources. Detailed methodology is provided at the end of reports. Try a keyword search for holiday.

Table from Mintel:  Impact of Inflation on Winter holiday purchases by household financial situation.

Detailed description of the methodology used for a consumer survey on Holdiay behavior conducted by Statista.

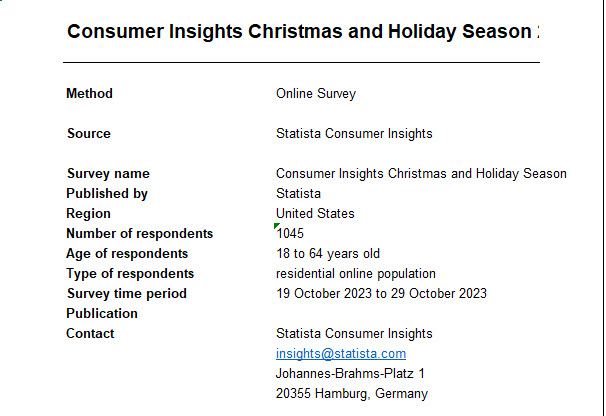
Based on consumer survey data, Statista is another good source for finding information about consumer behavior during the holiday season. It is international in scope. One recent report is Holiday Season and New Year in the US 2023, a consumer Insights data table: “Lavishly decorating their houses and gardens with light strings, real and fake Christmas trees as well as reindeer, snowmen and Santa Claus figures is only one of the many popular Christmas traditions of consumers in the United States”.  Details about the methodology is clearly provided.

eMarketer focuses on ecommerce. Data comes from in-house as well as external providers. Content includes articles, audio, charts, forecasts and reports. A simple search for holiday pulls up a number of results including Holiday Shopping 2023: Brick-and-Mortar and Ecommerce will battle for Retail Channel Supremacy. Reports can be downloaded in several formats including pdf, excel and ppt.

WARC (World Advertising Research Center) includes case studies, ad spend, rankings, strategies and more on all things advertising. It is international in scope. A simple search for holiday pulled up a topic category: Seasonal and occasion marketing. Here’s an interesting article about reusing older ads. It isn’t necessary to reinvent the wheel every advertising cycle.

For more Lippincott Library resources, use these guides: Advertising and Marketing Industries as well as Consumer Behavior and Demographics.

Happy Holidays!!!

Where can Wharton Students use Statistical Software for Free?

Taking a class that requires expensive statistical software? Maybe you use R or Python and your laptop just broke. Current Wharton students (plus staff and faculty) have alternatives that won’t cost extra.

Continue reading

The Library is Open!

Hello, Wharton students! Welcome to Lippincott Library and a new academic year. Find us online, chat with us during the day, email us after hours, call us at 215-898-5924 or head up to the second floor of Van Pelt-Dietrich Library and say hello! We’re here to support your research and academic needs. We offer a number of library services to do that.


RESEARCH TO GO. Have a question between classes? Visit us in Huntsman Hall! We hold office hours every Monday through Thursday 12:30 – 1:30 in JMHH 251.  Drop in and get quick answers for your job search or research questions.


business FAQ

Our Business FAQ is your 24/7 librarian. Search by keyword or concept to find resources on topics such as market research, company financials, analyst reports and more.

DOCUMENT DELIVERY. Available to undergraduate students, MBAs,  PhD candidates and Wharton faculty. Email docdel@wharton.upenn.edu to request articles and book chapters. Include the full citation for the fastest reply.

BUSINESS NEWS. Put away your wallet! Lippincott Library subscribes to major newspapers like the Wall Street Journal, the Financial Times, the New York Times, and many other business periodicals such as the Harvard Business Review and The Economist. You can read them in print in the library or online through several of our databases. You also now have access to WSJ Pro through Factiva. To limit your results to articles from WSJ Pro, click “Search” and then click “Source” below the “Free Text Search” box. Type WSJ Pro in the “Source” search bar and select any WSJ Pro sections of interest.

GROUP STUDY ROOMS.  Have a team project or group presentation?  Reserve a room  for your meeting. We have smaller study rooms for 4-5 people and two larger rooms that accommodate 10-12 people.

YABLON FINANCIAL RESOURCES LAB. Your one-stop-shop for access to Bloomberg and Capital IQ. Yablon is open to Wharton students only whenever Lippincott Library is open, and our librarians are happy to help you with these resources.

WORKSbloomberg120611_2_560HOPS.  On Wednesdays we talk about Bloomberg. Each week we offer Bloomberg training from 3:30 – 4:30 in Yablon Financial Resources Lab. It’s hands-on so be sure to come a few minutes early to create your own Bloomberg account. Register for this and other business workshops here.


TEXT BOOKS. We have library copies of textbooks for many Wharton courses on reserve at the Lippincott Services Desk.  Most textbooks can be checked out for three hours and used in the library. Check if we have your textbook in Franklin’s Course Reserves catalog.

cropped-datapointsheader.jpg

DATAPOINTS is Lippincott Library’s blog. Follow us for tips and tricks about library databases, new resources we’ve added to our collection, and more. And follow us on Twitter @LippincottLib for business news, library workshops, and more.

We hope to see you in Lippincott Library soon!

Mapping Your Way through Reference USA

refusa-header

If you’ve spent any time with our Company Information research guide, you know  Lippincott Library has a number of company directories. Reference USA has a few unique features that make checking it out well worth your time. Reference USA offers comprehensive coverage of both currently operating and closed businesses, and coverage of historical businesses from 2003 forward. Reference USA doesn’t just cover businesses. It also indexes the U.S. and Canadian White Pages, and tracks consumer lifestyles, moves, and home purchases. Also, Reference USA verifies all of its information by calling the businesses it indexes.

refusa-statistics

Now that you’ve seen the numbers of businesses in Reference USA, let’s take a look at what you can do with them. Reference USA’s strength is the number of search criteria it offers to help you generate a customized list of businesses or consumers, and the visualizations it can generate from your custom results lists.

refusa-search

If you’re looking for a specific person or business, the quick search will meet your needs, but Reference USA’s advanced search is its real strength. You can search across any or all of Reference USA’s business records, which covers over 44 million currently operating and closed businesses.

refusa-search-record-type

refusa-special-selects-criteria

In advanced search, you can limit your results by all of the standard search filters: company name, executive name or title, business or industry type (SIC code, NAICS code, or a keyword), by business size, number of employees, type of ownership (public or private), or by a business’s sales or financial data. But you can also limit your results with some Reference USA-specific filters like a business’s web presence or lack thereof, what social media platforms a business is active on, the size of their Yellow Page ads, or the square footage of their facilities.


You can also limit your results by geographic location. Reference USA offers the standard City, State, Region, and Zip Code geographic search filters, but their most interesting geographic search filter is the “Map Based Search” filter at the top of the list.

refusa-map-based-search

This search filter allows you to draw your own custom geographic region on a map of the United States and limit your search to that area. This search filter is particularly helpful for searching sections of states that aren’t part of traditional metro or city regions or for searching multiple custom or separate geographic regions. For example, I want to search for businesses in Pennsylvania around Pittsburgh and the surrounding area and also in Pennsylvania and New Jersey in Philadelphia and the surrounding area. I can do that with Map Based Search much more easily than with more traditional geographic search filters because I can draw an outline the area(s) I want to search directly on the map.

refusa-draw-your-own-map

When you’ve drawn lines around all the areas you want to search, you can apply your Map Based Search limit along with any of the other search limits. Click view results in the upper right corner, and you’ll generate a list of every business that meets all of your criteria.


You can click into each individual record for a detailed company description and history, and you can download any or all of these company records. (Downloads are limited to 250 records per batch if you’re using ReferenceUSA on-campus, and 150 records per batch off-campus. If you want to download company records in bulk, you also access ReferenceUSA’s company records through InfoGroup in WRDS.) You can also analyze these company records by each company’s SIC Code, city, zip code, sales volume, and number of employees, and you can generate a heat map of your results to analyze areas of concentration.


Now that I’ve mapped out how to use Reference USA, I hope you’ll check it out. Lippincott Library subscribes to a number of company directories, but Reference USA’s unique search filters and data visualization tools make it a powerful tool for researching a specific industry or geographic area. Whether you want to see where new businesses are opening up, check out the competition in an industry, or find out how many businesses are in a non-traditional geographic region, Reference USA can help.


Welcome to Lippincott Library Fall 2016

Welcome to the Fall 2016 semester and the Lippincott Library!!    The Lippincott Library supports the academic and research needs of the Wharton School.  Visit our website, contact us, chat with us, email lippinco@wharton.upenn.edu or stop by and see us.

Here’s a few tips to help get you started.

xmarksthespot

X marks the spot!!  Lippincott is located at 3420 Walnut Street.  Just look for the statue of “Broken Button“, located on Locust Walk at the entrance to the Van Pelt Library Building.  Lippincott is located on the 2nd floor, west wing of the building.

Use our Lippincott Services Guide to learn about all of our services.

yablon3

The Yablon Financial Resources Lab, located at the library, includes Bloomberg and Capital IQ terminals.  This space is available to Wharton students only whenever the building is open.


datapoints-forlipphome

Read  Datapoints, Lippincott’s blog,  to find out about business databases including content coverage and search tips. Posts also cover Workshops, such as Bloomberg 101 and other Library happenings.


Search the Business FAQ to locate the best resources to answer your research question.


tweet


Follow us on Twitter@LippincottLib


Book our group study rooms to practice presentations, hold meetings, and create content as a group.  These include 4 small study spaces, 2 group meeting rooms and a larger Seminar Room.

Join friends for a snack in Mark’s Café

1060_Marks-Cafe-5

Weigle2


Make use of all of the equipment and programs available at the Weigle Information Commons .


Sign up for workshops including Bloomberg 101, Entrepreneurship,  and Job Interview Prep.

Introduction to Bloomberg FX Functions

If you are interested in foreign exchange rates or other information on world currencies, Bloomberg is an excellent resource for that data. In this blog post, we will go over some of the basic FX functions that are available in Bloomberg.

To get started, hit the yellow [CURNCY] market sector key, and then hit the green [GO] key. This will display a menu of the main currency functions, giving you an overview of some of the options available to you when you are looking for currency and FX data.

One of the main FX functions is FXIP, the FX information portal.

1 - FXIP Screenshot

If you type in FXIP [GO], you will be taken to the FX markets overview screen. FXIP gives you a detailed overview of FX information, enabling you to get a quick snapshot of pricing information for various currency baskets. This is a great starting point for FX overview information before navigating to different screens for more detailed information, some of which are detailed below. The default currency for the FXIP screen is USD, but you are able to change that by typing in a different base currency at the amber box near the top of the screen. You can click on the different gray tabs for additional market overview information.

Continue reading

What’s Your Company’s RQ™ (Research Quotient)?

Research and Development (R&D) expenditure is the amount of money a company spends on developing new products and services each year.  Academic business researchers have intensively investigated the relationship between a company’s R&D and its market value, and have searched for ways to derive a firm’s optimal R&D spending.  A recent innovation in the analysis and measurement of a firm’s R&D has been the development of the concept of Research Quotient (RQ).

A company’s Research Quotient is the percentage increase in the company’s revenue from a 1% increase in its R&D. RQ is a measure of a firm’s ability to generate revenue from its R&D expenditures.  RQ is calculated from a formula that combines a company’s measure of capital, labor and R&D. For more details concerning RQ calculation, click on Manuals and Overviews from the WRDS Research Quotient database.

RQ can be used:

  • To Link R&D spending to firm growth
  • Link R&D spending to market value
  • Derive a firm’s optimal R&D spending

The WRDS RQ database includes RQ measures for all companies in the COMPUSTAT database that report R&D expenditures. The data covers 1972 to 2010 and is updated annually.  The file allows searching by 4 digit SIC and by GV Key (COMPUSTAT’s unique company identifier).

Table 1 is an example of the output showing some of the default variables.

TableOne

  • “Raw RQ” is the “Research Quotient” that identifies the ability of a firm to generate revenue from its R&D expenditures. The higher the RQ the greater the revenue generated.
  • “RSTAR” is a calculation of optimal R&D expenditure.
  • “RD Ratio” is the ratio of R&D expenditure to Revenue.

In Table 2, for clarification, I have supplied tickers and names of companies together with a measure of “RQ” that I calculated from the “Raw RQ” supplied by WRDS. This RQ is analogous to the human IQ measure with a mean of 100 and a standard deviation of 15. An RQ with a mean of 100 is often used by academic writers as a way of making the RQ measure more intuitive.

Table 2 ranks the first 20 companies in the U.S. by their RQ in 2010.

Table2improved

There are more than 260 four digit SIC codes represented in the 2010 files, but only 10 codes have more than 35 companies. Table 3 collapses the codes into 2 digits, and ranks the average RQ of the largest 15 industry groups.

Table3Formatted

About 78% of the companies in the 2010 file were based in the U.S.  Figure 1 graphs the countries with 3 or more companies in 2010 by average R&D expenditures and average RQ.

Figure1Formatted

The principal developer of the RQ concept is Anne Marie Knott, Professor of Business at Washington University, St. Louis. In a 2012 article in Harvard Business Review, she estimateds that if the 20 largest US firms had optimized their R&D expenditure in 2010, they would increase their aggregate market capitalization by $1 trillion. (Knott, Anne Marie. “The Trillion-Dollar R&D Fix.” Harvard Business Review (90:5) 2012, pp. 76-82.) This article can be accessed using Business Source Complete.

What did they say? Resources for transcripts and audios of Earnings Calls.

Earnings calls are conference calls or webcasts at which a public company’s management team discusses the company’s financial performance from the previous reporting period (usually a quarter). Participants include investors, financial analysts, and others, including shareholders. Reading transcripts from these earnings calls and listening to audio recordings can be a great way to glean information about a company’s performance and plans for its future directly from the company leaders themselves.

Presentation

While archival transcripts of calls can be easy to find, audio broadcasts of earnings calls can sometimes be more challenging to find. Often, companies will only make them available for a limited amount of time following the actual earnings call. If you wish to listen to the broadcast, you will need to keep track of when a particular company’s earnings calls are and how long they make their broadcasts available after the call. For example, Apple only makes their broadcasts available for two weeks after the call. While archives of audio recordings will not be as extensive as those for the written transcripts, you can often find at least the recordings for the last call or two for a given company.

The Lippincott Library has a number of resources where you can access these materials.

Continue reading

Wharton Students and Faculty: Lippincott Library has the Business Sources You Need!!

Welcome!!  Lippincott Library provides many resources to help you with all of your business research needs. We can help you to :

  • Prepare successful business plans
  • Prep for interviews
  • Screen for investments
  • Win case competitions
  • Write a research paper
  • Much more

Continue reading