At What Cost? Databases with Product Prices

image of price tag

Product prices are considered numerical gold by researchers and budding entrepreneurs. Typically proprietary, this data often comes at a high cost, an irony not lost on those who seek it. Fortunately, Lippincott Library provides access to several databases that contain product prices:

Mintel Global New Products Database (GNPD)

The Mintel Global New Products Database (GNPD) is a resource for researching the consumer packaged goods (CPG) marketplace. GNPD focuses on new products in the food, drink, beauty and personal care, home care, health and hygiene, and pet markets in 86 countries. In addition to new products, GNPD includes relaunched, reformulated, and repackaged products and new varieties or extended ranges of existing products.

To access GNPD from the Mintel platform, navigate to the Analytics menu at the top of the page and scroll over Products. From there, perform a basic keyword search or access the Advanced Search tool.

Product records provide Company & Source Details including manufacturer/distributor and name of retail store where the product was purchased, as well as Product Details including product description and positioning claims, package size, and product price at purchase location:

Mintel Global New Products Database sample cereal product record with product price outlined

Passport

This market information database covers consumer products and services on a global level. Prices are available for some products, such as Breakfast Cereals in USA:

Passport database price statistics for Breakfast Cereals in USA

Statista

Statista repackages third-party statistics from both publicly available and commercial sources, covering a variety of industries throughout the world. To locate available price statistics for a particular product, search for the product keyword followed by the word price (e.g. juice price). On the search results page, use the left side menu to filter results as desired, such as by geography.

For example, a keyword search for juice price with Countries & Territories limited to United States includes the following Beverage Digest chart depicting retail prices of juices and juice drinks in the United States from 2012 to 2019 in U.S. dollars per case:

Statista chart from Beverage Digest depicting retail price of juices and juice drinks in the United States from 2012 to 2019 (in U.S. dollars per case)

Statista’s charts and graphs include source information, making it easy to locate additional or updated price statistics from publicly available sources. For example, on the following chart depicting the average monthly retail price of orange juice in the United States from 2016 to 2020, the Sources field indicates that the U.S. Department of Agriculture is a source of this data, and the Source link is provided.
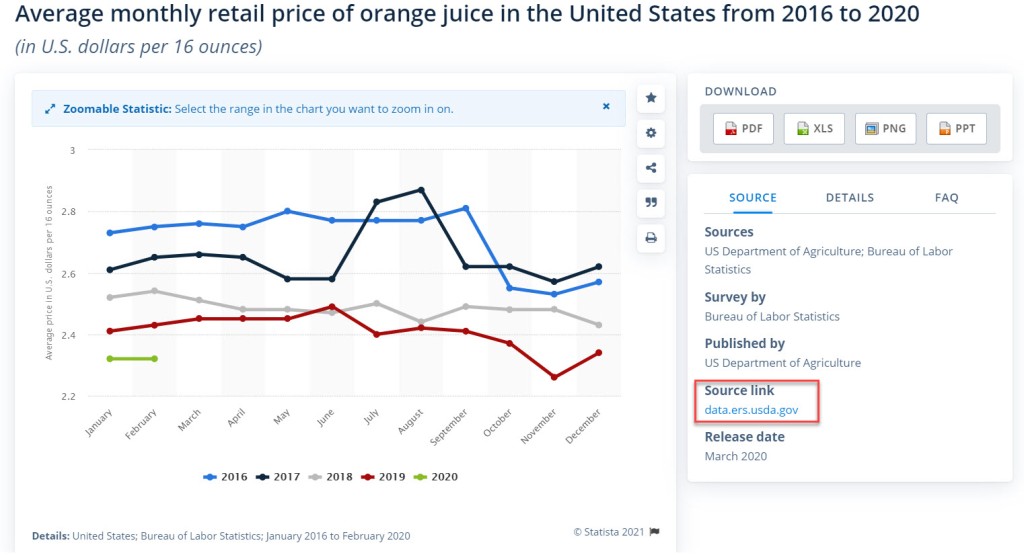
Statista graph for Average monthly retail price of orange juice in the United States from 2016 to 2020 (in U.S. dollars per 16 ounces), with U.S. Department of Agriculture Source link URL outlined

Clicking the source URL directs to a page on the USDA website featuring U.S. monthly average retail prices for fresh and processed fruits, including orange juice:

United States Department of Agriculture Economic Research Service's graph and statistics depicting U.S. monthly average retail prices for orange juice

ProcurementIQ

Designed to help purchasing and procurement managers make informed purchasing decisions, ProcurementIQ contains reports covering more than 1,000 indirect products and services in the United States. While reports target a commercial or industrial audience, some include residential focus. Search for a product by name (e.g. smoke detectors) to retrieve a report that includes a Price Environment section featuring a price summary, fundamentals, drivers, trends, forecasts, and more:

Price Environment visualization from ProcurementIQ report for smoke detectors

GlobalData Medical

GlobalData Medical focuses on the medical device, equipment, and supply industries throughout the world.

From the main menu, select Tools, then in the Medtrics Analysis Tool section, select the desired medical device product to access historical and forecasted Average Selling Prices for specific categories of medical device products across market segments and geographic areas. For example, this chart depicts Average Selling Prices for Laparoscopes in the General Surgery market across multiple countries from 2020 forecasted through 2023:

GlobalData Medical database's Market Average Selling Price for Laparoscopes in the General Surgery market in several countries for the years 2020 through 2023

CEIC

CEIC is a resource for global macroeconomic data. To access product price statistics from the CEIC landing page, open the Indicator menu and do a keyword search for price. Consumer or retail price statistics are available for a variety of products for countries throughout the world.

The CEIC chart below reflects recent retail prices of white granulated sugar in China:
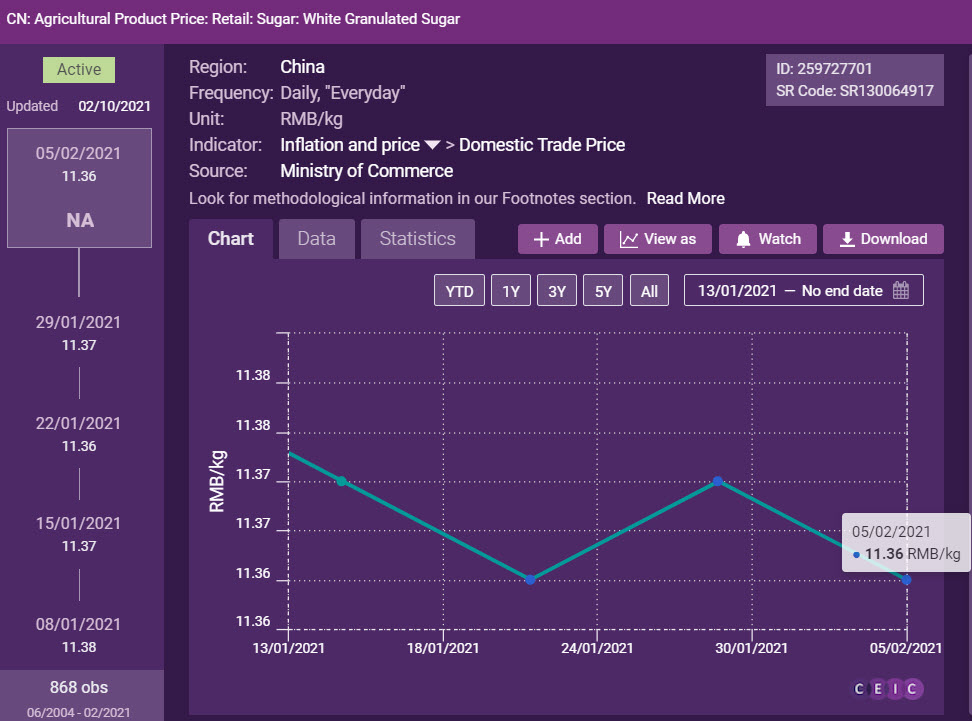
CEIC chart reflecting recent retail prices of white granulated sugar in China

The data can also be viewed and downloaded as a table:

CEIC table reflecting recent retail prices of white granulated sugar in China

When your research calls for product prices, start by exploring the databases above and contact a Lippincott Librarian for additional assistance.

Mega Fans and Mega Brands: Tracking sports teams, sponsorships, and social audiences with Sports Atlas

Take me out to the ball game, take me out with the crowd!

Except that, with social distancing measures still in place, most of us probably won’t be attending any Major League Baseball games this year. But, the season is still scheduled and Opening Day is quickly approaching. If you want to follow your favorite team and maybe even learn more about your fellow fans, try using Sports Atlas.

Sports Atlas is a new database put out by the publishers of Sports Business Journal, and it collects information about professional sports leagues, their member teams, venues, and sponsorships. You can track your favorite team’s recent deals, and get an idea of its fans and their interests. In this case, let’s investigate our home team here at Penn’s campus, the Philadelphia Phillies.

An image of a user search in Sports Atlas for the phrase Philadelphia Phillies

After perusing the Team Snapshot and quick links, you can view detailed information by tab. View a list of all current sponsored brands with deals with the Phillies organization; sort by # of Deals across all sports or narrow down to those most closely-held with the MLB, or in the geographic region.

An image showing a list of brand sponsors for the current season of the Philadelphia Phillies, ranked from most deals in Major League Baseball to least.

Use the Asset Library to put yourself right in Citizens Bank Park, the Phillies’ stadium; view photos, by season, of all of the signage around the ballpark (both virtual/digital and static/print) that can be claimed for brand sponsorships.

An image showing a few of the places around the Citizens Bank Park stadium where the Phillies play where a brand can put advertising on signage

The Social Audience tab gives great insight into the fans of the team via their social media followers. Sports Atlas measures how much more likely a Phillies fan is also follow certain brands on social media than the average MLB fan; it comes as no surprise to this Phillies fan that a follower of the team is 20.59 times more likely to follow the Twitter account for Wawa than the average MLB fan.

An image showing the top brand affinities: the top brands that Philadelphia Phillies fans follow on Twitter, compared to other MLB fans

How does this compare to other teams in the region? Use the Reports tab on the left to find ways that you can explore the Philadelphia, PA market overall.

An image showing how to navigate the Sports Atlas program to find Reports on Categories and Markets

You’ll first see the top brands and teams/organizations active in the area, then you can navigate to view by brands, the demographics of fans in the area using Census data, and to compare and contrast teams by social data. Here we can see the top four teams in this market — Phillies (MLB), 76ers (NBA), Flyers (NHL), and Eagles (NFL) — and see their fans’ brand affinities as a comparison table. Looks like Wawa’s sponsorship of the 76ers is paying off even more handsomely than it is for the Phillies!

An image showing a breakout of brand support by fans of four Philadelphia-area sports teams

Sports Atlas is fun to explore, sure, but it’s also an important tool for anyone researching sports business management, brand sponsorship & major deals, or audience demographics in the fan market.

Have Questions? We Have Answers! Lippincott’s Business FAQ

Magnifying glass enlarging the words "Frequently Asked Questions"

Looking for information on the medical device industry? Wondering where to find company financial ratios? Want to find the latest issue of Forbes or The Wall Street Journal? Look no further than Lippincott Library’s Business FAQ for answers to these and many other business research questions.

Accessible from the Lippincott Library home page and the search box on the Penn Libraries home page, the Business FAQ is the perfect starting point for many business research needs. This self-help resource currently includes more than 300 (and counting) questions and answers covering various aspects of business research and more.

Simply type a concept (keyword, phrase in quotes, or combination of words) into the Business FAQ search box on the Lippincott Library home page, click the Ask button, and a list of relevant questions appears. Select the question that fits your needs.

Business FAQ keyword search for bond

Answers feature hyperlinked resources with content overviews, access instructions, and details about why the resource would be more appropriate for a specific research need.

Business FAQ answer to the question "How do I find data on total returns for stocks, bonds, and indexes?"

Business FAQ questions and answers are maintained by Lippincott Librarians based on experience responding to questions from Wharton students and faculty.

If your question is not included in the Business FAQ, the system provides an option to “Submit Your Question” for addition to the FAQ repository:

Business FAQ Submit Your Question button

Fun facts about Lippincott’s Business FAQ:

The most popular question is “How do I find analyst reports (investment bank research)?” followed by “Where can I screen for companies by IPO date, and how do I find the IPO date of a specific company?” and “Where can I find credit and bond ratings for a particular company?

The Business FAQ includes resource access questions such as “How can I access Bloomberg?” and “Why am I having difficulty using Thomson ONE?

Answers often include both subscription and publicly available resources. For example, see answers to “How do I find data on consumer demographics and buying behavior?” and “Where can I find economic, industry, and country forecasts worldwide?

There are even FAQs intended for specific audiences. For example, “How may I use the library’s resources for classes or projects that involve working with an external client?” and “As an alumnus, which online business resources am I able to access when I visit the library?

Original software for the Business FAQ was created and maintained by the Penn Libraries Information Technology and Digital Design Department. Penn shared that software with other academic libraries that were members of the Business FAQ Consortium. Over the years, software platforms changed and now each academic library maintains its own Business FAQ repository.  

Next time you have a business research question, consult Lippincott’s Business FAQ for the answer!

Research Spotlight: Foreign competition for shares and the pricing of information asymmetry

The second installment of Research Spotlight, a Datapoints series focusing on research emerging from Wharton that has made use of library resources, highlights a paper co-authored by Wharton faculty member Robert E. Verrecchia. “Foreign competition for shares and the pricing of information asymmetry: Evidence from equity market liberalization” was published in the Journal of Accounting and Economics 67. 

By using the equity market liberalization of several emerging market countries within a ten-year period, this study examines how the degree of competition for a firm’s shares affects the pricing of information asymmetry. Among other resources, the authors used Bloomberg and Datastream to obtain accounting variables as part of their analysis, as well as additional macroeconomic data from Datastream. Bloomberg is the definitive source of information for security pricing, indicative and fundamental data, customized analytics and business news. And, as noted in an earlier post, Datastream is a historical financial database that covers equities, bonds, commodities, exchange rates, company fundamentals and more. 

For more information on these resources, please contact a Lippincott librarian

Reading is fun with Business Trends!

When you’ve got serious work to do, like writing a research paper or preparing for a job interview, Lippincott Library has resources to help. But did you know the library also has a selection of popular books to read for fun? If you’re interested in keeping up with general business topics, or looking for a way to pass the time on your commute, come check out the Business Trends section at Lippincott Library. Business Trends is a rotating collection of popular business books and bestsellers in marketing, management, and leadership.  

Business Trends display area and bookshelves filled with books in the Lippincott Library

You’ll find the Business Trends section as you’re walking into the library – across from the Information Desk and next to the periodicals. Business Trends has everything from biographies of business titans to management advice, and covers a wide variety of hot-button issues. Whether you want to know about AI technology or fast fashion, the gig economy or organic farming, Business Trends has got you covered.  

Here’s a few examples of popular titles you can find in the Business Trends collection: 

The Infinite Game, Simon Sinek 

Finite games have rules, scoreboards, and boundaries; when the whistle blows and the game is over, there are winners and losers. An infinite game, however, has no such clarity.  There are no rules, no endpoints, and no one goes home with a trophy – but using finite strategies is a sure way to lose. Simon Sinek offers advice on adapting to the infinite game of the business world by developing a resilient and forward-thinking mindset. Good leaders understand how to inspire others and build trusting environments, but Sinek argues that inspiration and cooperation are not enough: truly great leaders must be able to play the infinite game.  

The Age of Surveillance Capitalism, Shoshana Zuboff 

We live in a data-driven world, and many of us have accepted targeted ads and digital footprint tracking as part of the invisible, inevitable cost of using otherwise free services like Facebook and Google. Shoshana Zuboff delivers a blow to that complacency in her widely-discussed examination of surveillance capitalism, her term for the ominous new marketplace of human behavior prediction – and modification. Gone are the days of totalitarian states and Big Brother; Zuboff argues we now live in the shadow of “Big Other,” as unregulated and opaque private companies are given free rein to collect our data and influence our behavior.  

Work Wife: The Power of Female Friendship to Drive Successful Businesses, Erica Cerulo and Claire Mazur 

Erica Cerulo and Claire Mazur, friends and business partners, examine the unique benefits of female friendship in the business world. Sharing lessons from their own personal experience, as well as interviews with other women who have successfully navigated business partnerships, Cerulo and Mazur offer insight into what makes friendship among women in the workplace so special. Highlighting the importance of oft-ignored values like compassion and vulnerability, Cerulo and Mazur present a feminist vision of entrepreneurial cooperation.  

To check out these books (and many more!), stop by the Business Trends section the next time you visit Lippincott Library. With nearly one hundred titles covering a wide array of business topics, there’s sure to be something you’ll want to read. 

Detailed Cryptocurrency Data from Kaiko – Available Now!

Itching to analyze cryptocurrency data down to the tick? Kaiko’s rich historical data—accessible through the Lippincott Library—offer details from more than 50 exchanges and 7,500 currency pairs, letting you expand the boundaries of your research.

Kaiko logo
Continue reading

MIXing it up: microfinance data from MIX Market

Microfinance data is hard to come by since reporting requirements for Microfinance Institutions (MFIs) are not well-developed or consistent across countries. MIX Market focuses exclusively on providing information related these institutions, and their MIX Intelligence subscription lets you find information on specific institutions or screen for institutions using a wide range of criteria.   [Note: MIX Intelligence is not licensed for use outside the library, so you will have to visit Lippincott Library to use it. Just ask at our Information Desk for assistance with logging in.]

MIXResourcesMenu

The Resources menu is the primary way to navigate to reports, data and tools in MIX Market.  The easiest option is to select Profiles to look for a specific Financial Services Provider (FSP) or to screen for organizations by region, country and type. Profiles have top level information about organizations. This includes typical directory information, such as address, contact information and high level financials for the last three reported years, as well as links to annual reports if available. See the sample record below for CUMO, an MFI in Malawi.

CUMOProfile1CUMOProfile2

The profile page also lets you to easily access the FSP (Financial Service Provider) Analysis data on that organization, where each option under Report Types allows you to select individual variables

FSPAdditionaCriteria

Example of available social performance variables

Use the Cross Market Analysis function to select from more than 100 specific data points to compare, such as assets, administrative expenses, average loan balance per borrower, renegotiated loans, and many more. The additional filtering and grouping options allow you to create results like the table below, which shows the number of female active borrowers by country.

CrossMarketAnalysis-Gender

In addition to making tools available that you can use to create your own analyses, MIX publishes regular quarterly reports that include their analysis and visualization of data Forecast-Bangladeshby country. These are generally produced on a quarterly basis and include country overviews called “factsheets” which include quarter-by-quarter performance across common variables such as average loan balance, number of active borrowers and portfolio-at-risk at the country level. Their “barometer forecasts” also provide forecast data from on a quarterly survey of FSPs. The snapshot on the left illustrates the projected borrower growth rates for Bangladesh. 


Please see our Microfinance Research Guide for additional resources.

CBD and THC: green light for investment

Image of a cannabis plant
Image by Roberto Valdivia

A recent article in Bloomberg News instantly grabbed my attention.  Joe Montana, quarterback extraordinaire and football icon, now a venture capitalist, just participated in a $75 million funding for a company that sells marijuana products in stores throughout California.  Taking a risk on a controversial investment, Joe is positioned to win in an industry which he hopes can make a “serious impact on opiod use or addiction”.  In fact, cannabis related products could help football players or others in high impact, injury prone professions. This industry includes growers and retailers as well as medical and recreational products.

Like Joe, investors seem sweet on cannabis derived products that provide health and wellness benefits. But where is this industry headed as a business investment? How great is the risk? What are the opportunities? the library has a number of resources that can help to answer these questions.

Continue reading

At last, Pitchbook has come along…

Lippincott Library is proud to announce the addition of Pitchbook to our list of business resources. Covering a vast array of data related to private capital markets, Pitchbook can provide the Wharton community with research information on private equity and venture capital. You will need to create an account, based on your Penn email address. There are download limitations:  Each individual has 25 downloads per month and can use up to 10 in a day.  Unlimited access using the API function in excel is available for public companies.

Continue reading

Hands Off the Wheel!

Lippincott Librarians sense trends as we help Penn students, faculty and staff dig for industry research, articles and data. In 2014, I worked with students researching machine vision and self-driving cars, and over the years, I have seen an increasing number of questions about the industry and technologies behind it. In 2019, I helped a student research Nuro, the Mountain View, California based robot delivery van company that has reached unicorn status, as reported in Inc. Just this week, Crunchbase reported that Uber is in talks for a $1B funding round for their self-driving car unit, a testament to how far businesses in this industry have come. As librarians, we observe industry life cycles through the support we offer to Penn.

Knowledge@Wharton recently featured a podcast with engineer Samuel I. Schwartz, author of No One at the Wheel: Driverless Cars and the Road of the Future, a book available through Van Pelt Library.

Photo of cars with signals around them on a highway.

If you are interested in learning more about the autonomous vehicle space, Lippincott Library and the Penn Libraries have resources beyond books, useful for researching emerging industries.

Continue reading